Back in 2018 we published a quick‑and‑dirty table that classified follower gains as very poor to very good. Five API updates and a short‑form video boom later, the question hasn’t changed—“Is my account growing fast enough?”—but the context definitely has. Buckle in as we break down modern Instagram follower growth rates, show real data from creator dashboards, and talk about what those numbers mean for your social media ROI.
The old scale — still handy, but update your expectations
(2018 influencerDB cheat‑sheet reproduced in plain text)
| Growth verdict | % followers gained per month |
|---|---|
| Very poor | < 0 % |
| Poor | 0 – 2.5 % |
| Fair | 2.5 – 5 % |
| Good | 5 – 7.5 % |
| Very good | > 7.5 % |
In 2025 TikTok cross‑pollination and Reels discovery have nudged the ceiling higher. Many nano creators now flirt with 10 % monthly spurts, while macro accounts consider 3 % healthy. Keep that in the back of your mind as we tour the graphs.
Different growth curves over twelve months
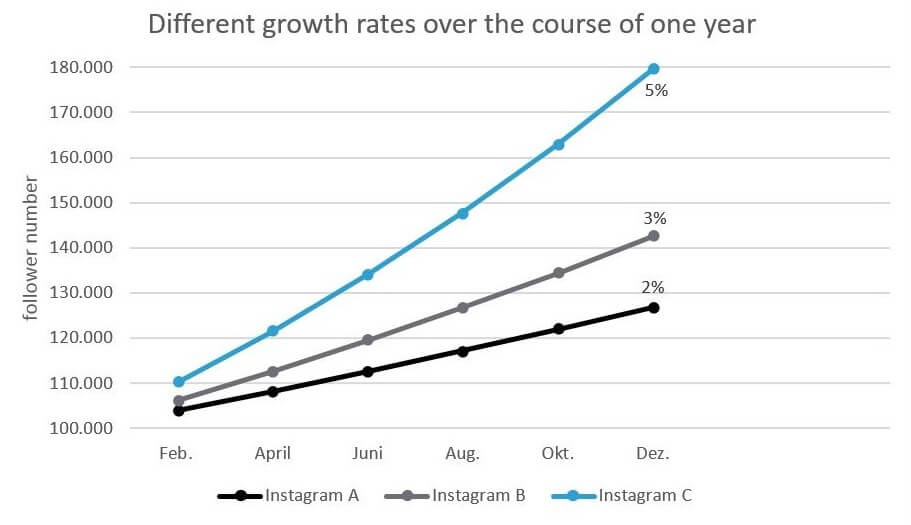
Instagram C grabs your eye—5 % steady growth snowballs from 110 k to 180 k followers inside a year. That compounding effect is why brands chase incremental lifts; small improvements today widen your funnel tomorrow.
Take‑home: Once you stabilise content quality, tune posting cadence and collaboration strategy—one percent monthly gain adds ~14 % to your reach year over year.
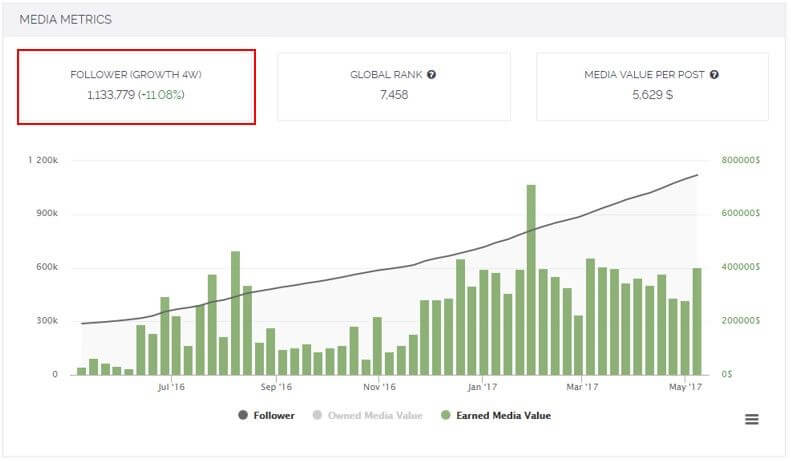
Case Study 1: @carodaur’s breakout year
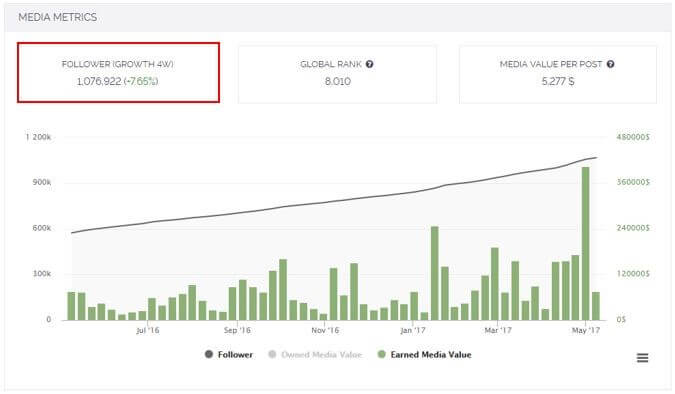
In early 2017 Caro Daur went from nice to watch to cannot scroll without seeing. A single Vogue feature sparked 7.6× follower growth in four weeks. Notice the green bars: each represents earned media value generated by mentions she didn’t pay for. That’s the moment follower growth turns into measurable social media ROI.
Case Study 2: @ohhcouture’s long‑game compounding
Leonie Hanne’s curve proves you don’t need one monster spike to win. Consistent 3 %–4 % monthly increases layered over stunning travel content set the stage; a single viral airport reel (you know the one) sent her over the million‑gain mark. The kicker? Media value per post shot from $1 600 to $5 600 inside 90 days.
Posting frequency, mentions, and algorithm favour
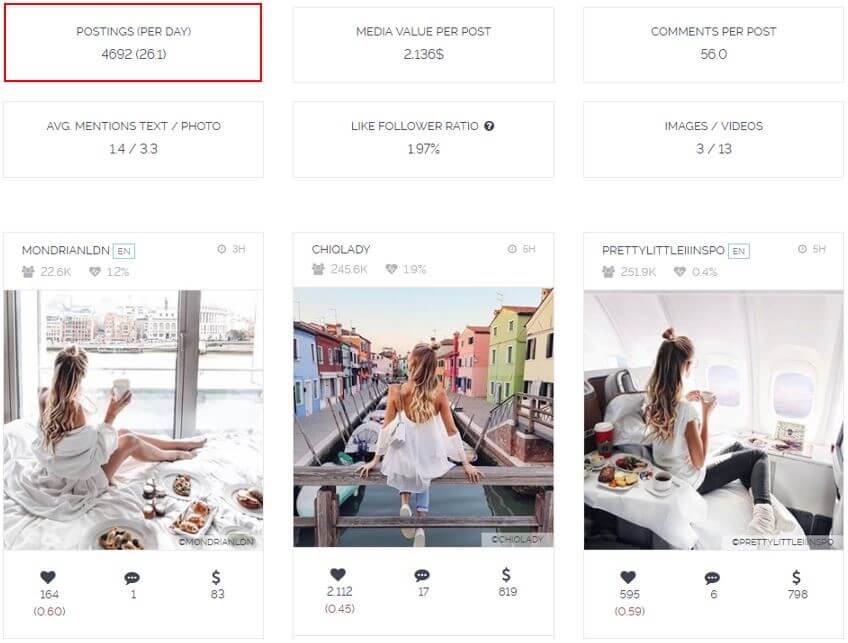
At 4.7 posts per day the risk of fatigue is real, yet her like‑to‑follower ratio held near 2 %. Why? Mentions were 14× higher than photo tags—people talked about her more than she talked about herself. That conversational pull feeds discovery, which in turn sustains follower growth without endless ad spend.
How to benchmark your own account in three steps
- Pick a rolling window. We recommend 28 days to smooth weekday spikes.
- Log net new followers and divide by start‑of‑period followers.
- Contextualise: nano < 2 k followers? Aim for 4 % monthly. Macro > 500 k? Celebrate 2.5 %.
A spreadsheet works, but piping data into our forthcoming analytics layer will automate thresholds, peer comparisons, and anomaly alerts. (Yes, the devs are on it.)
So, what’s “good” in 2025?
- Nano (< 10 k) | 5 %+ / month is realistic if you hit Reels discovery
- Micro (10 k–100 k) | 3 %–4 % keeps you ahead of churn
- Mid (100 k–500 k) | 2 %–3 % sustainable with collabs & giveaways
- Macro (> 500 k) | 1.5 %–2.5 % excellent unless you’re headline famous
Remember: follower curves impress investors, but social media ROI pays the bills. Track clicks, sales and earned media alongside raw growth.
Need a money‑side reality check on instagram follower growth rates? Read our latest study The 2024 Pay‑Scale of Instagram’s Highest‑Paid Influencers & Their ROI.
What’s next?
We’re re‑engineering our influencerDB platform to surface these insights in real time—no spreadsheet gymnastics required. While the new system bakes, use the tables and examples above to grade your own curve, and keep nudging that percentage north.
Written over two flat whites, three Slack pings from the dev cave, and a spreadsheet full of growth curves. Stay tuned—the next iteration of our database will calculate these benchmarks for you, not the other way around.